Paleoclimate graph misused to deny global warming
- This article is more than one year old.
- Published on November 25, 2024 at 21:54
- 4 min read
- By Manon JACOB, AFP USA
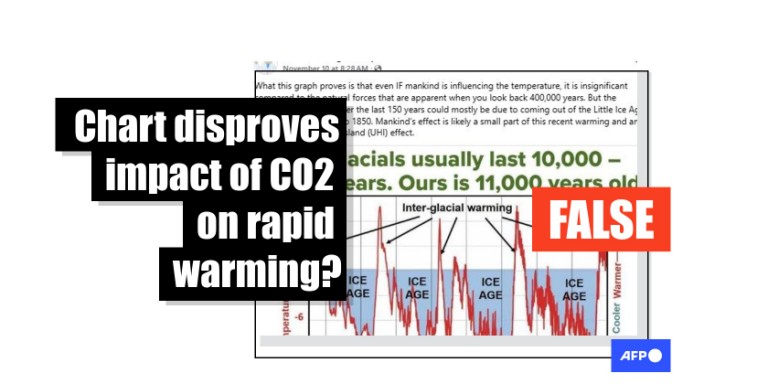
"What this graph proves is that even IF mankind is influencing the temperature, it is insignificant compared to the natural forces that are apparent when you look back 400,000 years. But the temperature change over the last 150 years could mostly be due to coming out of the Little Ice Age that lasted from 1200 to 1850," claims a November 10, 2024 Facebook post, shared thousands of times.
It includes a chart seemingly showing ice ages and corresponding temperature anomalies over hundreds of thousands of years that was originally published by the CO2 Coalition -- a group lobbying against mandated reductions to CO2 emissions (archived here).

Similar claims have spread on social media via other climate-skeptic accounts, including repeatedly-debunked former Fox News commentator Steve Milloy.
Ice ages are caused partly by changes in Sun exposure due to natural variations (archived here) in the Earth's orbit, combined with the influence of planet-warming greenhouse gases in the atmosphere.
The most recent glacial period occurred between about 120,000 and 11,500 years ago (archived here).
Since then, Earth has been in an "interglacial period," which is described as a part of the cycle when it is warmer and the extent of ice on land is lower.
"We are presently in a so-called interglacial, or warm period. So yes, there are quite large natural variations in climate," said University of Southern Denmark's geology professor, Donald Canfield (archived here), on November 22.
"However, that doesn't mean that man cannot impact" the recent warming trends.
The United Nations Intergovernmental Panel on Climate Change (IPCC) says it is "unequivocal that human influence has warmed the atmosphere, ocean and land" -- tied to CO2 emissions (archived here and here).
"Both CO2 and temperature have increased to values far beyond what was seen before the 'little ice age' began," Canfield said. "There is broad agreement that recent CO2 increases are man-driven, and therefore, so are the associated temperature increased."
Additional scientists told AFP the data in the graph shared online does not disprove the role of human-induced emissions in climate change or its significance.
"The graph does not include the recent warming data, but ends before significant human climate impacts could be recorded," said Bärbel Hönisch, a professor of environmental sciences at Columbia University's Lamont-Doherty Earth Observatory (archived here), on November 21.
NASA space research scientist, Thomas Fauchez (archived here) told AFP on November 22 the graph shared on social media uses information gathered and presented by glaciologist and climatologist Jean Jouzel (archived here), "but distorts the data from its context through time scales that are completely different."
He said the time scale illustrated does not show the last 150 years with enough precision to account for the impact of the Industrial Revolution.
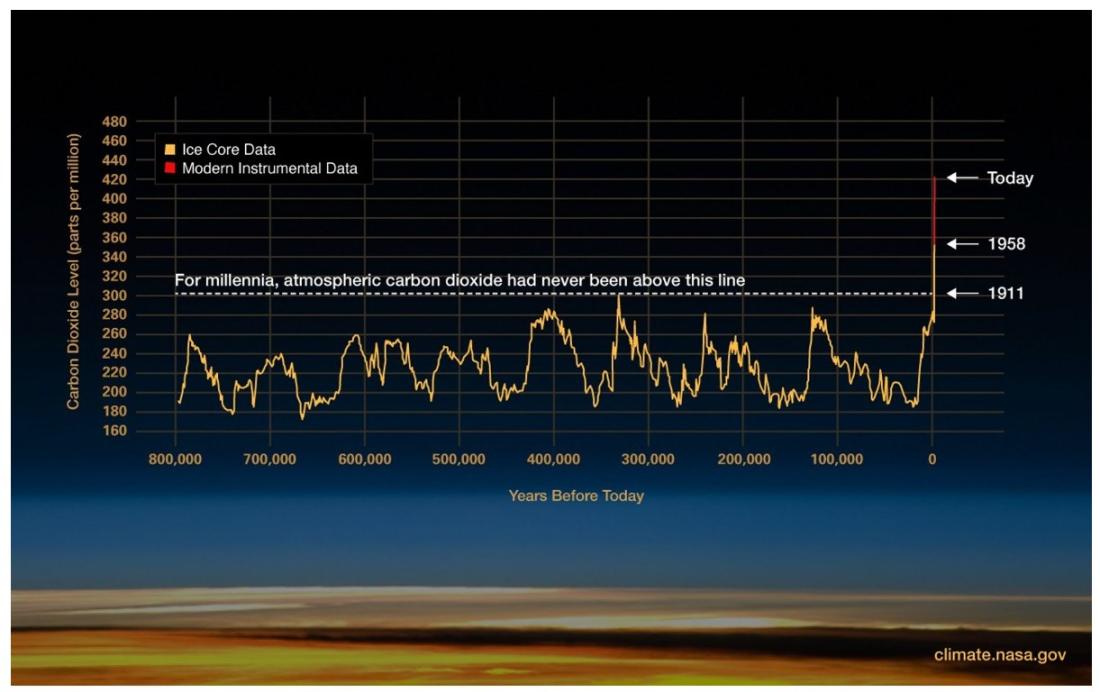
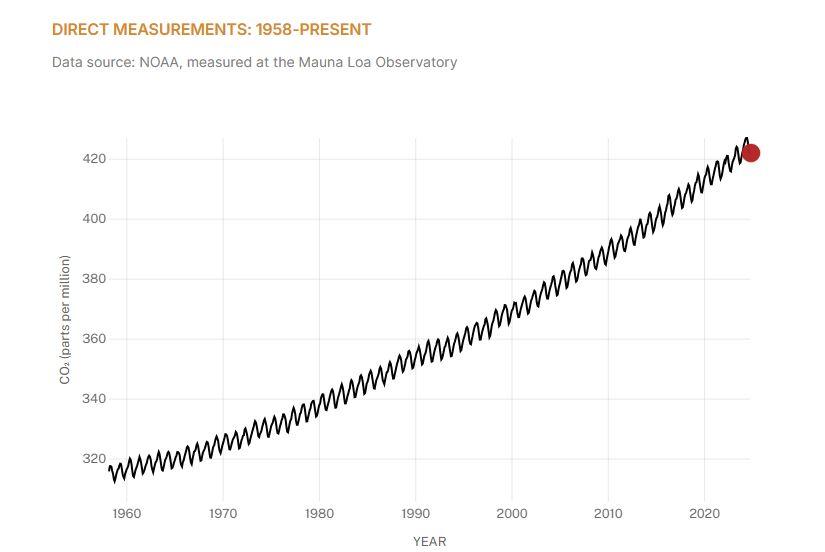
In contrast, NASA illustrates the drastic increase in warming by comparing carbon dioxide levels from atmospheric samples contained in ice cores and more recent direct measurements (archived here).
Reliable weather records date back to the late 1800s when widespread land surface temperature observations started. Older proxy data for climate change from geological cores is used to show Earth's Ice Ages.

CO2 driving warming
Scientists AFP spoke with also agreed humans are adding greenhouse gases to natural cycles at a much faster rate than what has been observed in millennia.
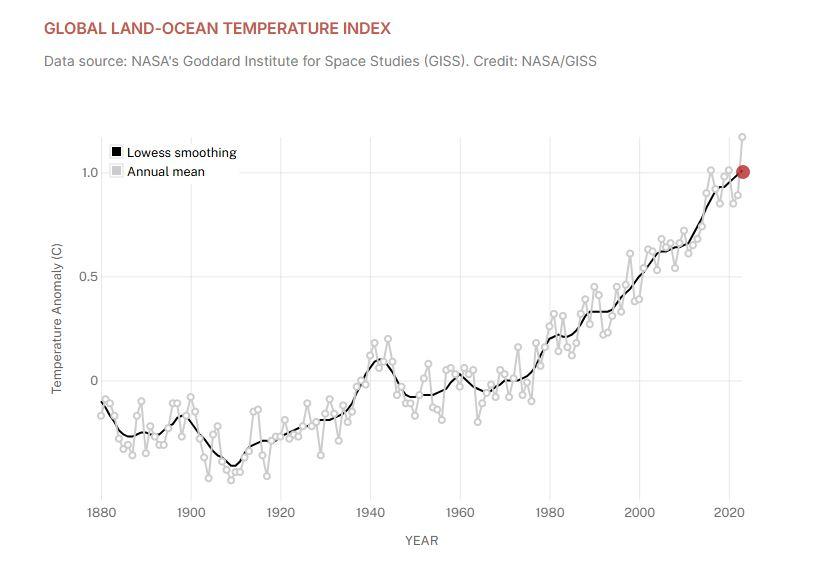
As CO2 concentrations increase, so do temperature anomalies, indicating that rising CO2 levels are a primary driver of Earth's warming trend, specifically over the last 150 years, as demonstrated in the NASA graphs (archived here), below.


The last time carbon dioxide in the atmosphere matched today's human-driven levels was millions of years ago, scientists say.
NASA's Fauchez said that it was "quite simply impossible for such an increase of carbon dioxide not to impact our climate and Earth's average temperatures."
He explained: "If we go from levels of CO2 from 280 parts per million (the pre-industrial levels) to the current 423.6 ppms (archived here), the planet will warm."
The increase in global average surface temperature that has consistently occurred since the pre-industrial era reflect a significant increase in accumulated heat (archived here).
AFP has debunked other false and misleading claims about paleoclimate and human-induced warming, including here and here.
Copyright © AFP 2017-2026. Any commercial use of this content requires a subscription. Click here to find out more.
Is there content that you would like AFP to fact-check? Get in touch.
Contact us


