Photo shows forecast of tsunami path in Japan after 2011 earthquake
- This article is more than five years old.
- Published on April 19, 2021 at 11:00
- 2 min read
- By AFP Hong Kong
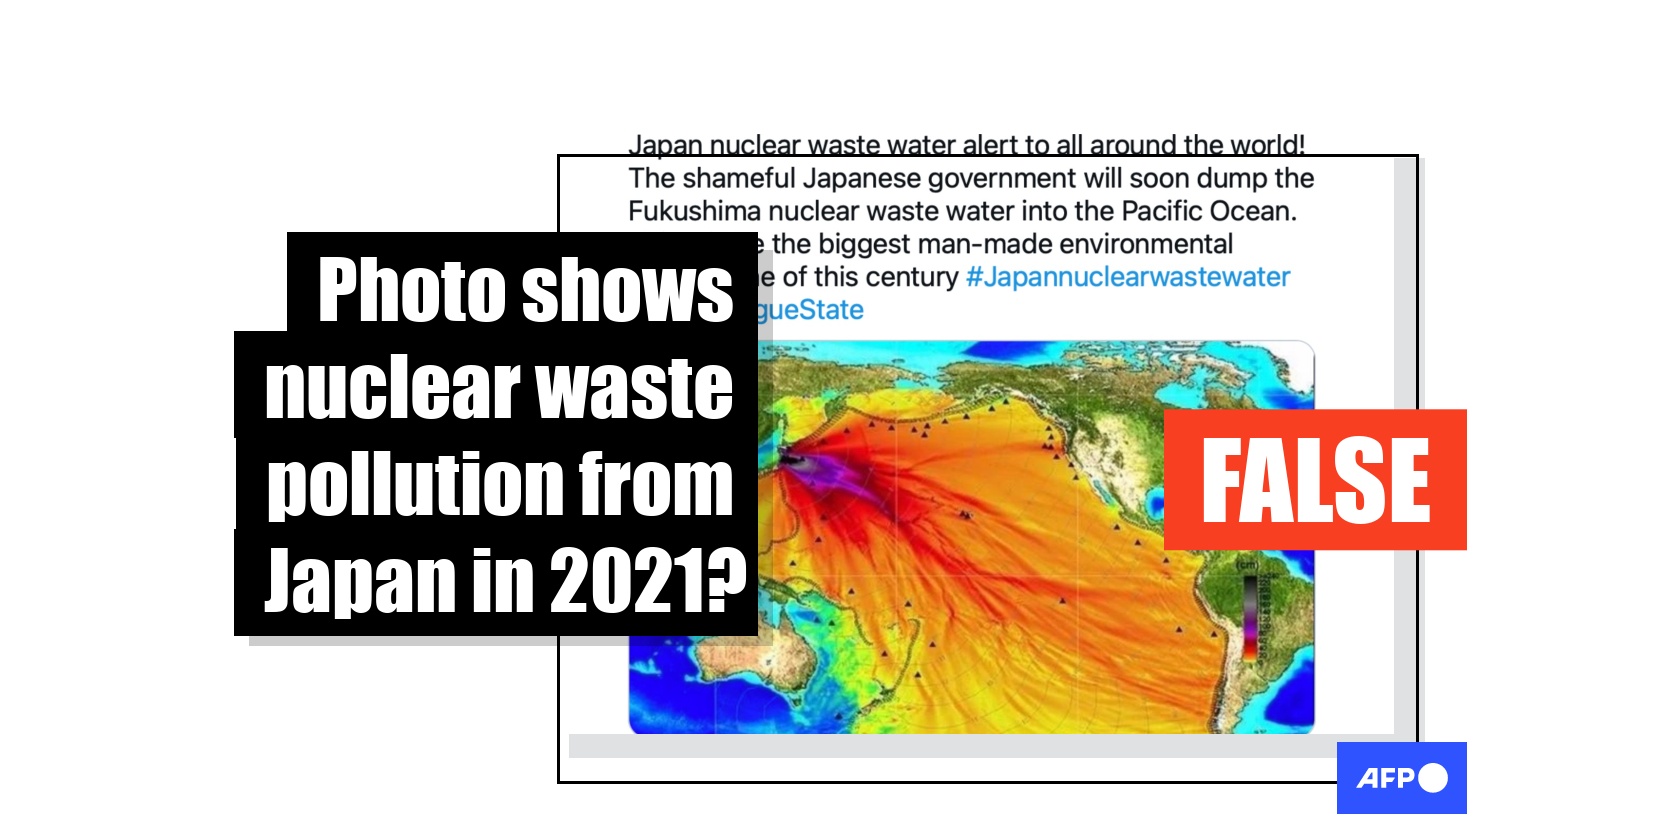
The photo was posted on Twitter on April 10, 2021.
It shows various colour markings on a world map.
It is captioned: “Japan nuclear waste water alert to all around the world! The shameful Japanese government will soon dump the Fukushima nuclear waste water into the Pacific Ocean. This will be the biggest man-made environmental catastrophe of this century #Japannuclearwastewater #JapanRogueState”.
The post circulated online after Japan announced it would release more than one million tonnes of treated water from the Fukushima nuclear plant into the ocean.
The announcement triggered a furious reaction from countries including China and South Korea, AFP reported.
But the Japanese government argued the release is safe because the water will be processed to remove radioactive elements.
The photo was also shared alongside a similar claim on the Chinese microblogging site Weibo here and here; on Facebook here and here; and on Twitter here and here.
The claim is false: the photo is unrelated to nuclear waste pollution.
Combined reverse image and keyword searches on Google found the photo corresponds to several graphics published by the US National Oceanic and Atmospheric Administration (NOAA) following the massive earthquake that struck Japan’s Tohoku region on March 11, 2011.
According to the NOAA: “The graphics display forecast results, showing qualitative and quantitative information about the tsunami, including tsunami wave interaction with ocean floor bathymetric features, and neighboring coastlines.”
Below is a screenshot comparison of the photo in the misleading posts (L) and the NOAA photo (R):
The same photo was also posted with the correct caption by Getty on March 11, 2011.
The Getty Images photo credits NOAA. It is captioned: “Filled colors show maximum computed tsunami amplitude in cm during 24 hours of wave propagation. Black contours show computed tsunami arrival time. A magnitude 8.9 strong earthquake hit the northeast coast of Japan causing Tsunami alerts throughout countries bordering the Pacific Ocean.”
In response to the misleading posts, a NOAA spokesperson told AFP in an email on April 16, 2020: “Obviously, the tweet greatly mischaracterizes the Tohoku tsunami map. [The map] is a plot of the maximum wave amplitude from the Tohoku tsunami of March 2011.”
AFP previously debunked misleading posts about radiation from Fukushima that shared a miscaptioned NOAA graphic.
Copyright © AFP 2017-2026. Any commercial use of this content requires a subscription. Click here to find out more.
Is there content that you would like AFP to fact-check? Get in touch.
Contact us