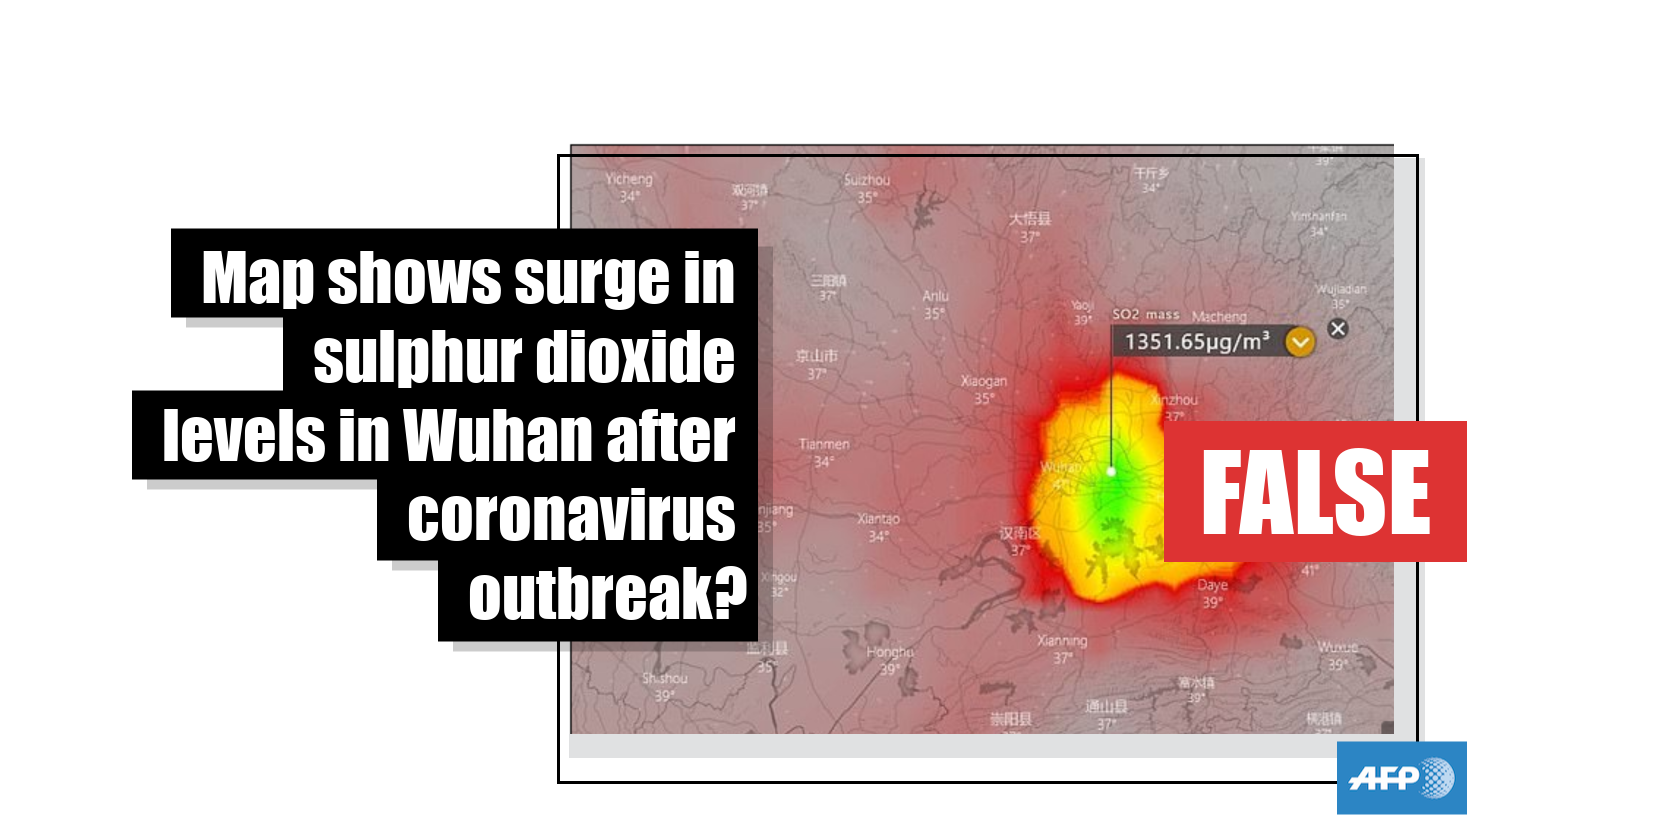
This map is a forecast based on past data, not real-time satellite readings
- This article is more than five years old.
- Published on February 21, 2020 at 04:10
- Updated on March 3, 2020 at 14:35
- 3 min read
- By AFP Australia
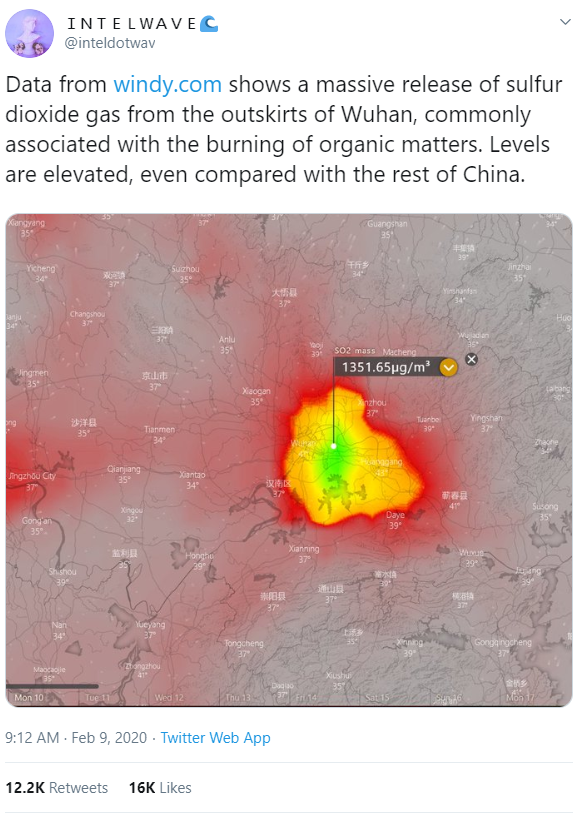
The map has been retweeted more than 12,000 times from this Twitter post after it was published on February 9, 2020.
Below is a screenshot of the misleading tweet:

The post’s caption states: “Data from http://windy.com shows a massive release of sulfur dioxide gas from the outskirts of Wuhan, commonly associated with the burning of organic matters. Levels are elevated, even compared with the rest of China.”
The map indicates that 1351.65 µg/m3 of sulphur dioxide (SO2), a harmful gas most often emitted during fossil fuel combustion, was detected between February 10 and 17, 2020, in areas around Wuhan.
The map was also shared alongside a similar claim here, here, here and here on Twitter; here, here, here and here on Facebook; and here on YouTube.
It was shared alongside a similar claim in other languages, such as here and here in Chinese, and here in Korean.
Media reports featuring the purported map were also published here by MailOnline, the website for British newspaper The Daily Mail; here by Malaysian newspaper China Press; here by US newspaper The Epoch Times and here by US broadcaster New Tang Dynasty Television.
The novel coronavirus epidemic has since killed at least 2,118 people and infected more than 74,000 others in China, AFP reported here on February 20.
While the vast majority of deaths have been in Wuhan, claims that the map in the misleading posts shows elevated sulphur dioxide levels in the city is false.
Windy.com, the animated weather forecast website where the map was created, said the map represents a forecast based on NASA data.
In an email to AFP on February 20, the website said: “Please note that Windy.com only visualizes a forecast of SO2, data for this prediction are obtained from NASA and their model NASA GEOS-5, that means Windy.com does not calculate any data on its own and further questions regarding model details about measurements should be directed to NASA only. We also do not store archive weather data.”
Windy.com also provided similar answers on February 9 and 10 in response to a query titled “Wuhan Sulfur Dioxide Levels Abnormally High or Just Industry?” that refers to the misleading posts on social media.
Dr. Arlindo da Silva, a NASA research meteorologist, also said that NASA’s SO2 readings do not measure day-to-day fluctuations.
“Our forecasts are based on fixed emission inventories and once SO2 is emitted it is transported by forecast winds,” da Silva told AFP by email on February 20. “Although satellite data has been used in the construction of the emission inventories, these emissions do not account for the day-to-day variations in SO2 emissions and as such cannot account for sudden changes in human activity.”
The China National Environmental Monitoring Center on February 13 issued a press release titled “Reports on gas density refuted”, denying claims of elevated SO2 levels in Wuhan.
It states, in part: “The China National Environmental Monitoring Center refuted a report posted on foreign websites that Hubei provincial capital Wuhan, the epicenter of the novel coronavirus outbreak, has experienced a marked increase in its sulphur dioxide density, saying ‘it's a severe distortion of reality’.
“An analysis conducted by satellite experts also showed that the sulphur dioxide density had been kept at a low level in Wuhan and its surrounding areas from Feb 3 to Sunday… The highest density the analysis found during that period was 11.5 mcg/cubic m on Feb 4-far below the concentration of 1,300 mcg/cubic m reported by the website for that time”.
Copyright © AFP 2017-2026. Any commercial use of this content requires a subscription. Click here to find out more.
Is there content that you would like AFP to fact-check? Get in touch.
Contact us
