No, the Arctic ice cover is not growing
- This article is more than six years old.
- Published on March 11, 2019 at 22:16
- Updated on March 12, 2019 at 18:49
- 4 min read
- By Louis BAUDOIN-LAARMAN
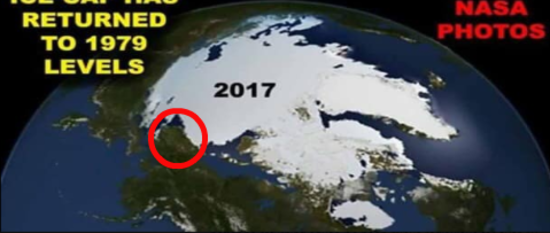
A collage of three satellite views of the Arctic oceans in 1979, 2012, and 2017, shows sea ice retreating from 1979 to 2012, and expanding between 2012 and 2017. “North Pole ice cap has returned to 1979 levels,” explains the caption for the images allegedly based on “NASA photos.”

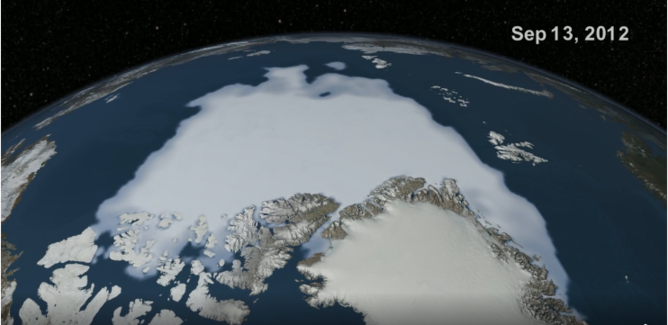
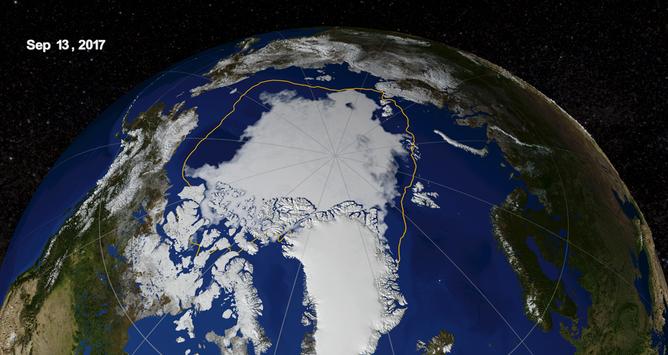
The post misleads by comparing end-of-summer ice coverage with winter ice coverage in the Arctic. The 2012 photo on the top right shows Arctic sea ice at its yearly minimum, on September 13 of that year. The yellow line marks the 30-year average minimum sea ice extent.
Noting this, NASA spokesperson Patrick Lynch called the satellite imagery used in the post “quite significantly inaccurate and out of context.” He added that the images were not NASA photos, but in fact animations based on satellite observations.

Sea ice evolution for the year 2012-2013 can be watched in detail at this link.
The photo used to depict the 2017 ice cover is misleading because it does not show the end-of-summer ice extent, which was the eighth lowest on record that year, according to the US National Snow and Ice Data Center (NSIDC). Although the Arctic ice cover was as large or larger than the post shows at some points in 2017, a proper comparison would show the polar ice cap in September 2017, as shown below.

The video below shows Arctic sea ice coverage day-by-day from March to September 2017.
Moreover, the bottom image of the Facebook post seems to have been altered. Alaska’s northern coast appears to extend into the Arctic ocean more than in reality.

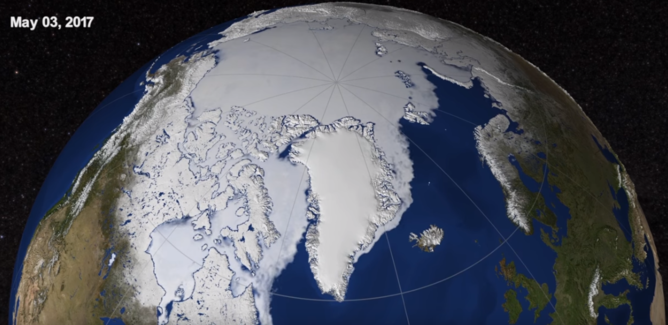
Walt Maier, a NSIDC researcher, told AFP if the image was a real picture from 2017, it would be from May or June, when sea ice is at its peak coverage.
To be sure, ice covers nearly all of the Arctic ocean during some periods of the year, such as during the end of the winter and spring, as shown in the image below.

Maier, who helps produce and analyze ice coverage data, and can be heard narrating some of the NASA videos featured in this article, said that “to compare the ice cover between years, one needs to compare at the same time of the year.”
A similar post from 2013, which was shared on Facebook, claimed that the “ice sheet” had grown 920,000 squares miles between August 2012 and August 2013.

This was also misleading. The August 2012 photo on the left is miscaptioned, as “the smallest extent on record”, when this actually occurred in September 2012. The August 2013 average extent, Meier pointed out, was 1.38 million square kilometers (or 533,000 square miles) larger than the August 2012 extent, nearly half the 920,000 square miles mentioned in the post. This translates into a roughly 30 percent increase, not 60 percent as the right-hand photo’s caption claims.
The 920,000 false figure was the result of a mistake on the NSIDC’s September 4, 2013 Arctic sea ice report. The figures were later changed to their correct number, although visual content using the wrong figure remains online. The UK’s Daily Mail, which had published the original numbers, issued a correction explaining the mistake.
Since the 2012 ice cover was the smallest of any year on record, the fact that the 2013 ice coverage was greater “is not surprising and does not represent a recovery,” Meier told AFP.
Although the extent of the Arctic ice shelf does fluctuate from year to year, overall coverage has been greatly reduced since the 1970s, a trend that further accelerated after 2007, NASA’s Lynch said. At its minimum in September 2018, the Arctic ice shelf was the sixth lowest on record, with less than 3.41 million square kilometers (2.1 million square miles) of coverage. Overall, Arctic sea ice has retreated by roughly 3 percent per decade since 1979, according to the NSIDC. At its lowest in September 1979, Arctic sea ice covered 6.936 million square kilometers (4.3 million square miles).
All data for the Arctic and Antarctic sea ice coverage since 1979 can be found at NSIDC’s web page here.
CORRECTION: This article was updated on March 12, 2019 to replace Arctic ice shelf with the
scientifically correct term, Arctic sea ice, throughout.
Copyright © AFP 2017-2026. Any commercial use of this content requires a subscription. Click here to find out more.
Is there content that you would like AFP to fact-check? Get in touch.
Contact us
