Map used to make misleading comparison of COVID-19 spread in US, Canada
- This article is more than five years old.
- Published on June 24, 2020 at 18:44
- Updated on September 16, 2020 at 15:46
- 2 min read
- By Alex CADIER, AFP Canada
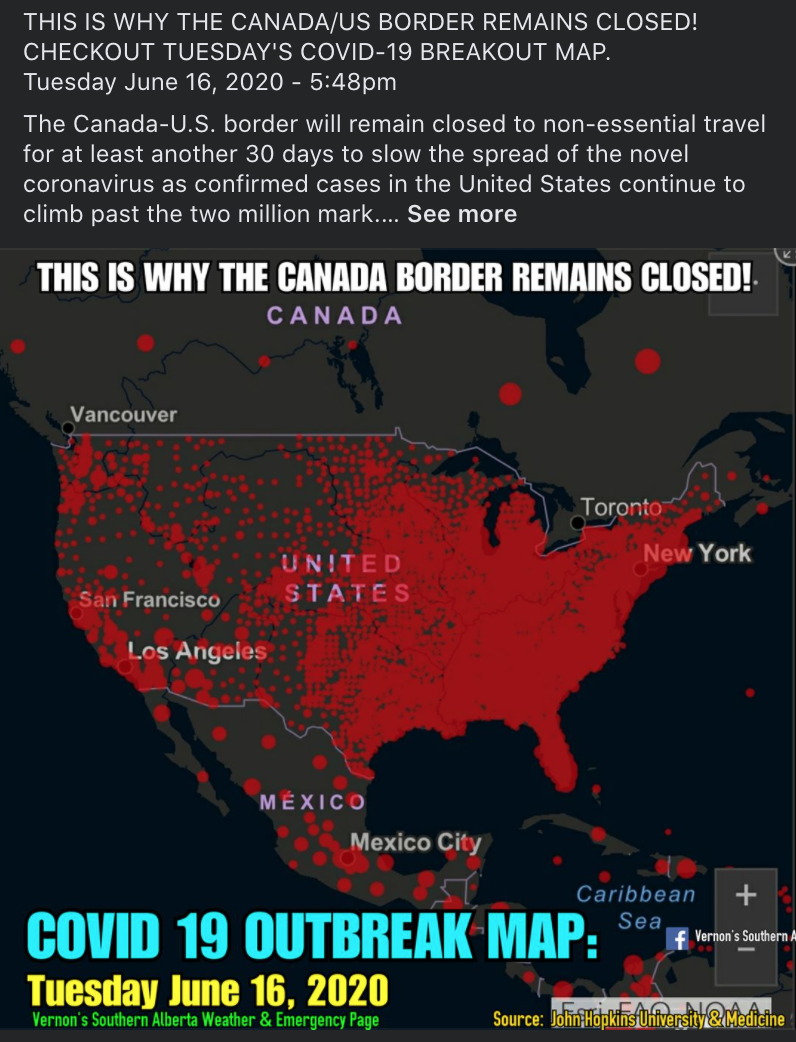
“CHECKOUT TUESDAY'S COVID-19 BREAKOUT MAP,” claims a post, shared 15,000 times since June 16, 2020, featuring the map and a message that pushes for the border to remain shut.

Screenshot of a Facebook post taken on June 23, 2020
AFP conducted a reverse image search using Google images and Yandex to establish that the map in the post is a screenshot of this Johns Hopkins University COVID-19 dashboard which tracks COVID-19 cases.
Johns Hopkins said that the screenshot in the post would have been taken on June 16, 2020, as claimed in the post.
“You will see there are multiple tabs under the main map that visualize the data in different formats: cumulative confirmed cases, active cases, incidence rate, case-fatality ratio, testing rate, hospitalization rates. The screenshot you provided shows confirmed cases,” Doug Donovan, a spokesman for Johns Hopkins University told AFP in an email.
The US is by far the nation hardest hit by the deadly novel coronavirus. However, the map shows the location of confirmed cases by county in the United States, while reporting in Canada is provided by province.
“The Johns Hopkins map depicts confirmed cases in each of the nearly 3,200 counties in the United States and depicts Canadian cases at the province level. Currently there are 2.3 million cases in the United States and 103,418 cases in Canada,” Donovan clarified.
The map in the post also does not depict an outbreak but rather the cumulative confirmed cases, which includes deaths, active cases and recovered patients.
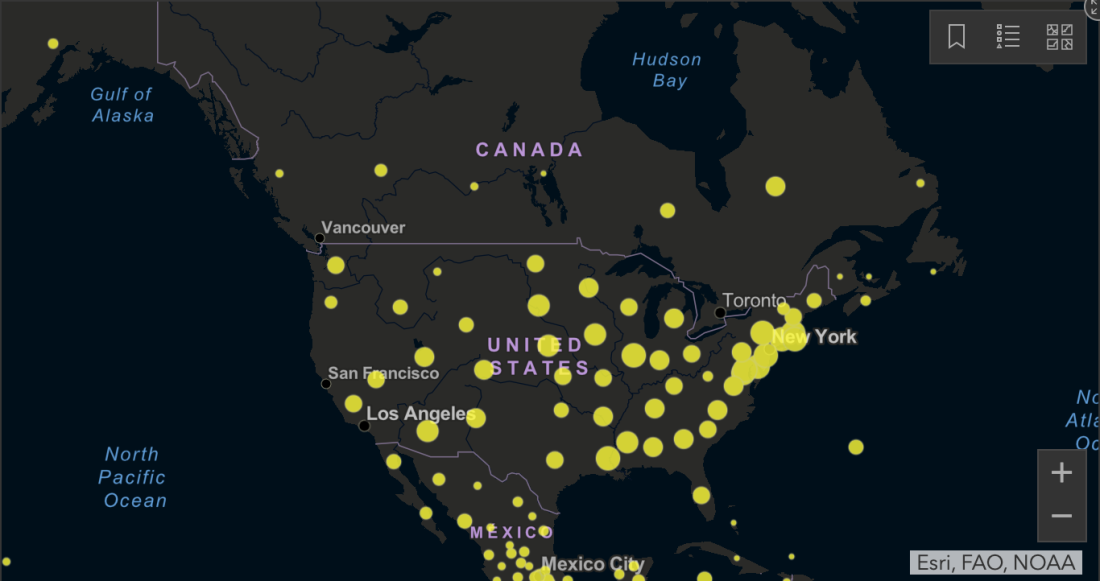
“Comparing cumulative case numbers between two countries with massively different populations and population densities is not advisable,” Donovan said, “You will find a more apples-to-apples comparison with the tab labeled ‘incidence rate’.”

Screenshot of the incidence rate map taken on June 23, 2020
“For example, Quebec has an incidence rate of 642.8 per 100,000 people, which is nearly on par with Michigan’s 680.5 per 100,000 people. Michigan’s population is about 10 million; Quebec’s is about 8.5 million,” Donovan said.
On June 16, 2020, Canadian Prime Minister Justin Trudeau announced the latest extension of the US-Canadian border closure, as reported here by AFP.
The North County Chamber of Commerce, which represents 3,200 businesses in New York State and Quebec has criticized the Canadian premier’s move, calling it an “act of bi-national economic and social mismanagement of the world's most important social and economic partnership”.
The border closure, put in place in March, saw the number of vehicles entering Canada fall by more than 78 percent between February and April 2020 according to Statistics Canada.
However, the US has seen more than half its states hit by a surge in cases in the past two weeks, a spike that coincides with governors’ reopening their economies and loosening restrictions earlier imposed to curb the spread of COVID-19.
Dr Anthony Fauci, the country’s top expert on infectious diseases, on June 23 described the spike in infections as “disturbing” and warned that it showed the pandemic was not under control.
Copyright © AFP 2017-2026. Any commercial use of this content requires a subscription. Click here to find out more.
Is there content that you would like AFP to fact-check? Get in touch.
Contact us


