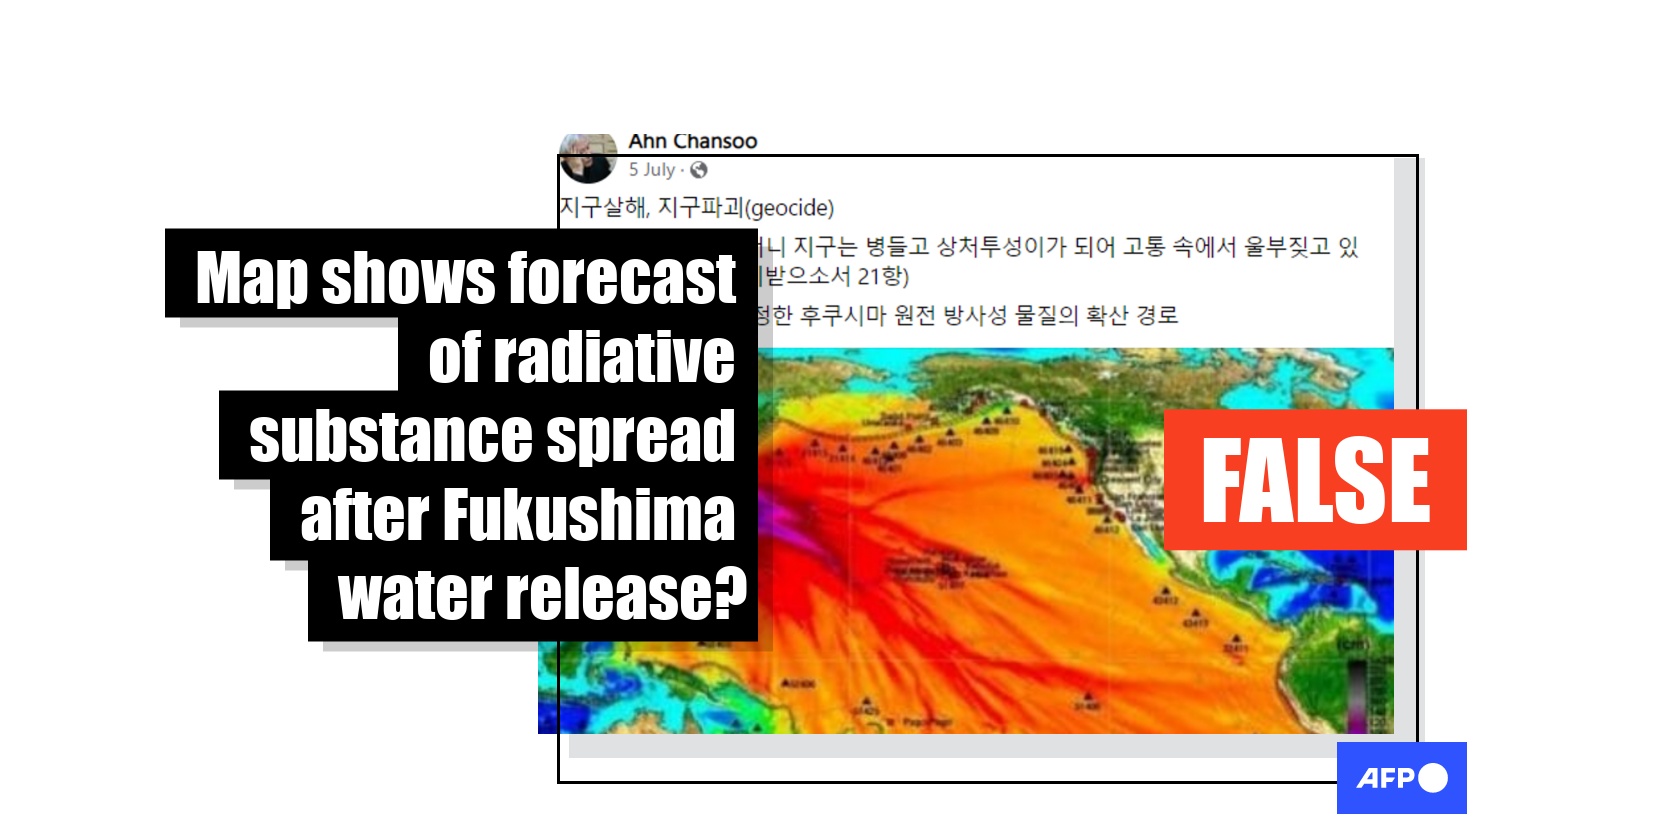
Old graphic of tsunami wave forecast falsely linked to Japan nuclear wastewater release
- This article is more than two years old.
- Published on August 29, 2023 at 09:17
- 2 min read
- By AFP South Korea
- Translation and adaptation Hailey JO
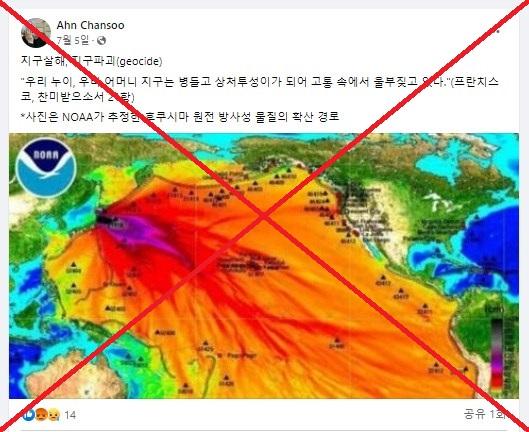
A map with NOAA's logo was posted on Facebook on July 5, 2023 with a caption in Korean that reads: "The destruction of the Earth, geocide. The photo shows the spread path of radioactive materials from the Fukushima nuclear power plant estimated by the NOAA."

The post was shared online after Japan secured approval from the nuclear watchdog IAEA for its plan to release more than one million tonnes of treated wastewater from the Fukushima nuclear plant into the sea.
The water was collected on-site over 12 years after the plant was swamped by a tsunami that overwhelmed the cooling systems at the plant.
Japan began to discharge the water on August 24 despite opposition from neighbouring countries, including South Korea and China.
The claim was also shared on Facebook here, here and here; and in Chinese here, here, here, here and here.
But the claim is false. The image in fact shows the NOAA's estimation of the amplitude of tsunami waves triggered by the 2011 earthquake as they travelled around the Pacific Ocean.
Wave heights estimation
A NOAA spokesperson told AFP on August 25 that the image was produced by its Center for Tsunami Research shortly after a tsunami triggered by an undersea earthquake hit Japan in 2011.
The spokesperson went on to say the image "depicts maximum tsunami wave heights and not radiation", stating that the image includes a centimetre scale for reference.
Combined reverse image and keyword searches on Google found the graph in the misleading post was in fact a cropped version of a larger map uploaded to the NOAA's website here (archived here and here).
"The graphics display forecast results, showing qualitative and quantitative information about the tsunami, including tsunami wave interaction with ocean floor bathymetric features, and neighbouring coastlines," the NOAA website reads.
The larger map on the NOAA website includes the text: "Japan (Tohoku) tsunami, March 11, 2011. Maximum wave amplitudes". This text appears to have been cropped out in the misleading posts.
Below is a comparison of the map as seen in the misleading posts (left) and on the NOAA website (right):

Photo news agency Getty Images also published the graphic on March 11, 2011 with a caption that describes it as the NOAA's forecast after the 2011 earthquake (archived link).
AFP has previously debunked posts that shared the same NOAA graphic alongside false claims.
Copyright © AFP 2017-2026. Any commercial use of this content requires a subscription. Click here to find out more.
Is there content that you would like AFP to fact-check? Get in touch.
Contact us
