Video misleads on data on CO2-driven warming
- This article is more than four years old.
- Published on January 18, 2022 at 16:33
- Updated on January 18, 2022 at 16:49
- 5 min read
- By AFP Canada
"Satellite data show no net warming for the past seven years, something impossible to reconcile with the simplistic 'more CO2 equals more heat' equation," says the text of a December 27, 2021 Facebook post accompanying a video from the group Climate Discussion Nexus.
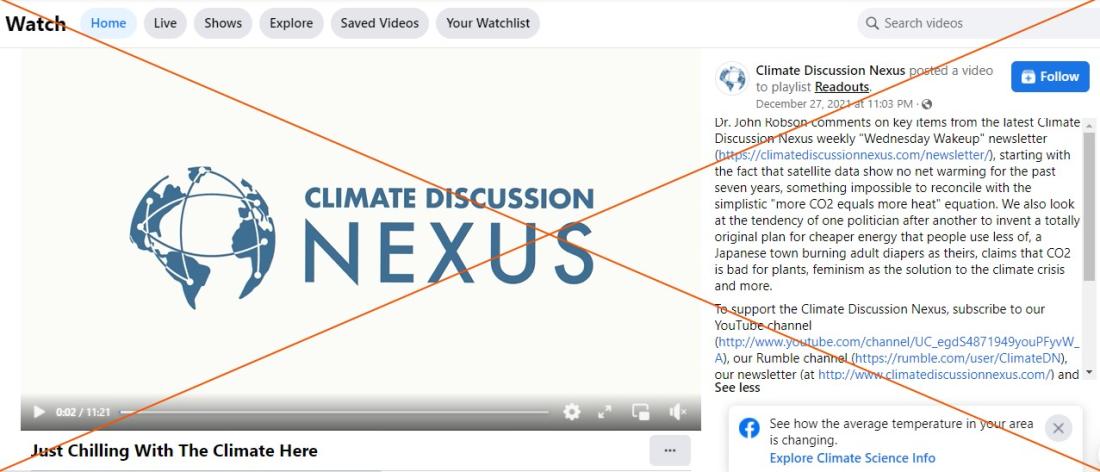
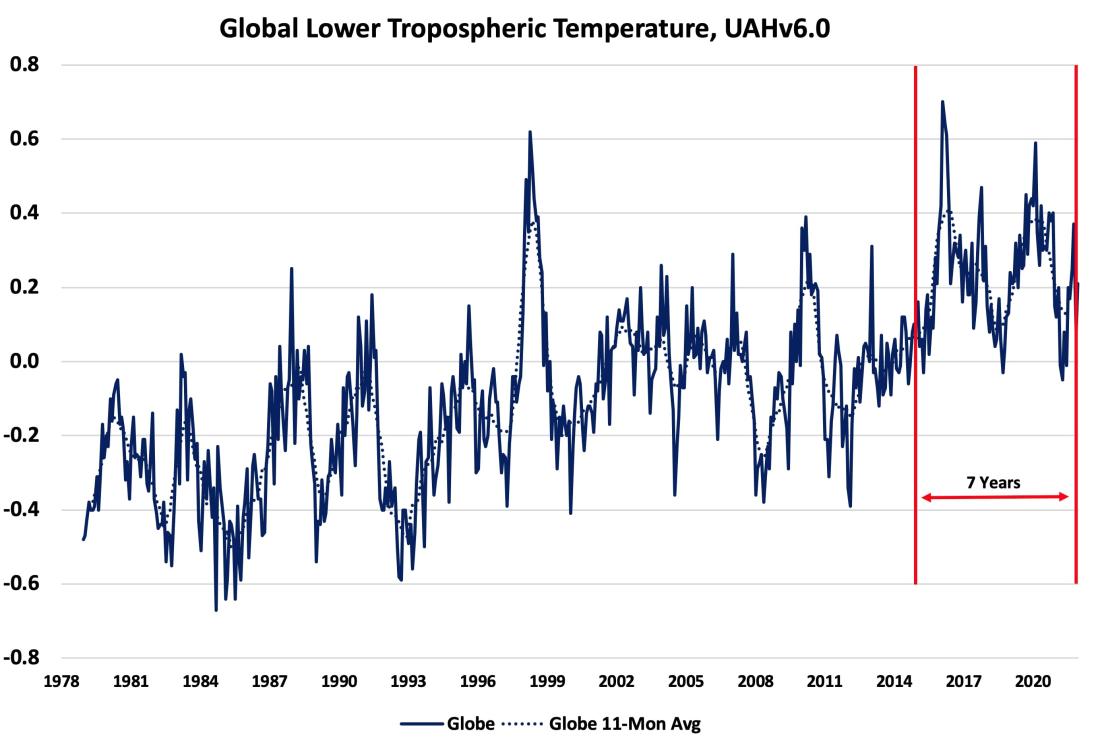
The video, which was also posted on YouTube and Rumble, presents data from the University of Alabama in Huntsville (UAH) and also cites the Hadley Centre and Britain's Met Office. The data showed that temperatures fluctuated but evened out on average from 2015-2021 (in the UAH data) and 2014-2022 (HadCRUT data).
"It seems there's been no boring, old-fashioned 'the temperature actually went up' warming for nearly seven years now, since January of 2015. Or to be more precise, no net warming," says the presenter in the video. "There was a temperature spike in 2020 because of an El Niño, as there was in 2016. But the best satellite data say that the ups and downs typical of real-world climate have left us no warmer now than before anyone had declared an emergency."
The claims come as governments around the world race to address what scientists claim is a growing crisis that could have far-reaching impacts around the world if not addressed.
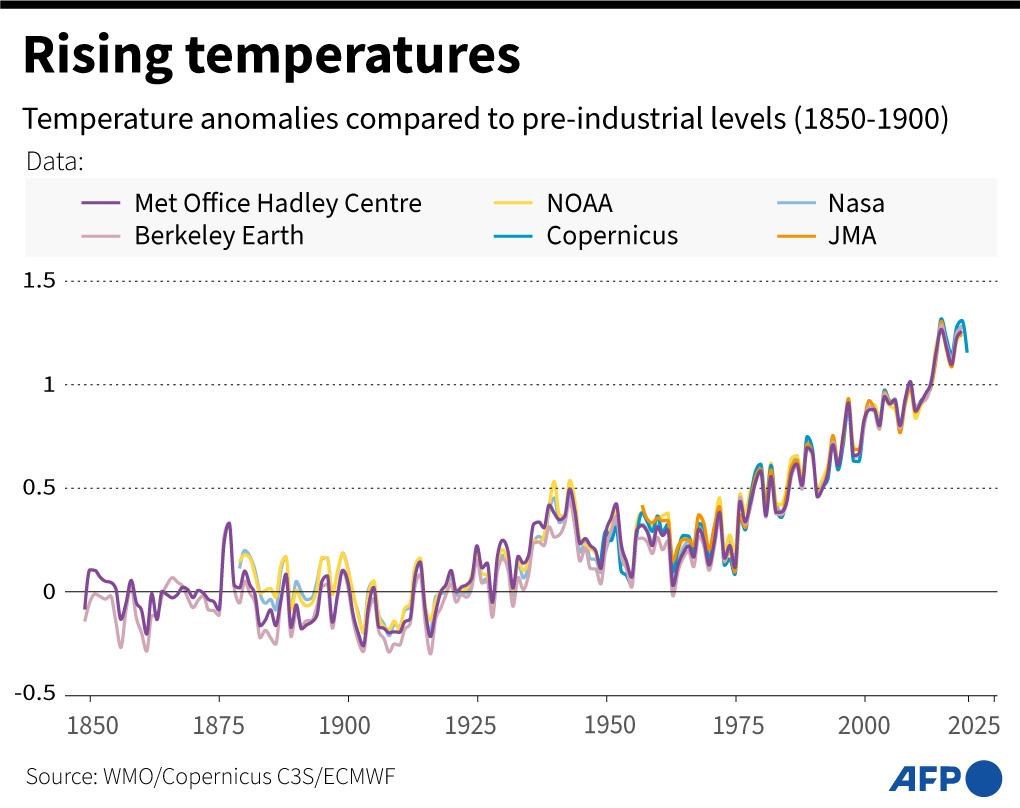
Broader global data show that the video is misleading: to measure how the gases released by the burning of fossil fuels are causing the planet to heat, climatologists measure temperature trends going back decades. Data going back to 1850 track how the planet has warmed since humans started burning carbon fuels during the Industrial Revolution.
In a report last year by more than 200 scientists from 66 countries, the UN Intergovernmental Panel on Climate Change (IPCC) said global temperatures have risen 1.1 degrees Celsius since the 1850-1900 period due to humans burning fossil fuels, driving an increase in the intensity and frequency of weather disasters.
It warned that if emissions were not curbed, temperatures would breach the 1.5C limit agreed on by nations at the COP26 climate summit in November and would continue to rise.
The European Union's climate monitoring service reported on January 10 that the past seven years were the hottest on record.
A report on January 13 from the US National Oceanic and Atmospheric Administration (NOAA) showed that the nine years spanning 2013-2021 all rank among the 10 hottest on record. "After two consecutive years (2019 and 2020) that ranked among the top three warmest on record, Earth was a slightly cooler planet in 2021. But not by much," the NOAA said in a statement, adding that "2021 ranked sixth on the list of warmest years on record, dating back to 1880."
The warming trend over recent decades is mirrored in data sets used by six international sources: the European Centre for Medium-Range Weather Forecasts (ECMWF - the ERA5 dataset used by Copernicus), the NOAA's GlobalTemp set; the JRA-55 set from the Japanese Meteorological Agency - used in the Copernicus study - Britain's Met Office (HadCRUT5); NASA (GISTEMPv4) and a set from the Berkeley Earth non-profit group in California:
The seven- and eight-year periods cited by the video have jagged ups and downs of temperatures marked by an El Niño warming event around the start and a later La Niña cooling event, with temperatures evening out on average over that stretch of time.
The video report "cherry picks seven years" of data, Freja Vamborg, a senior climate scientist at the Copernicus Climate Change Service, told AFP in a video call. "It is always misleading to just show a cutout of data without talking about the data that comes before it," she said.
"The important thing is that we know from a climate point of view that cumulative greenhouse gases in the atmosphere is the main reason we have seen since the pre-industrial era" for warming.
"When we look at the IPCC (findings) and (consider) when may we pass the 1.5 degree target, we don't look at one year, we don't look at five years - we look at 20 years ... and even 30 years, because we know that within those timescales there can be variations," Vamborg said.
She said the global data published by Copernicus draw on readings from all available meteorological sources, including satellites, weather stations, buoys at sea and aircraft.
To track broad changes in the global climate, scientists compare the average temperature for a given period with an earlier period -- a point of comparison known as a baseline.
"Rather than taking just six or seven years, we need to look at long term trends. Since the 1980s each decade has been warmer than the previous one," Clare Nullis, a media officer at the World Meteorological Organization (WMO), told AFP by email. The WMO counts 193 states and territories among its members.
"That is why we use long-term baselines of 30 years to calculate global temperatures plus the baseline of the pre-industrial era (1850-1900) before greenhouse gases had any warming impact on the climate. It's misleading to say there has been 'no net warming' for seven years."
The Met Office forecasts that the average global temperature for 2022 will be between 0.97 degrees Celsius and 1.21 degrees Celsius above the average for the pre-industrial period.
January 18, 2022 This article was updated to edit the caption on the chart from the University of Alabama in Huntsville.
Copyright © AFP 2017-2026. Any commercial use of this content requires a subscription. Click here to find out more.
Is there content that you would like AFP to fact-check? Get in touch.
Contact us
